
In this short tutorial, you'll learn how to turn a simple Excel spreadsheet into an app. The logic from the Spreadsheet remains in the app and can be extended with additional functions.
How to build a calculation app for iOS, Android, and Web in just a few minutes?
The app created in this tutorial will consist of one input field and four results. It is a very simple example, which is dedicated to giving you a "quick start".
FIRST STEPS TO YOUR OWN APP:
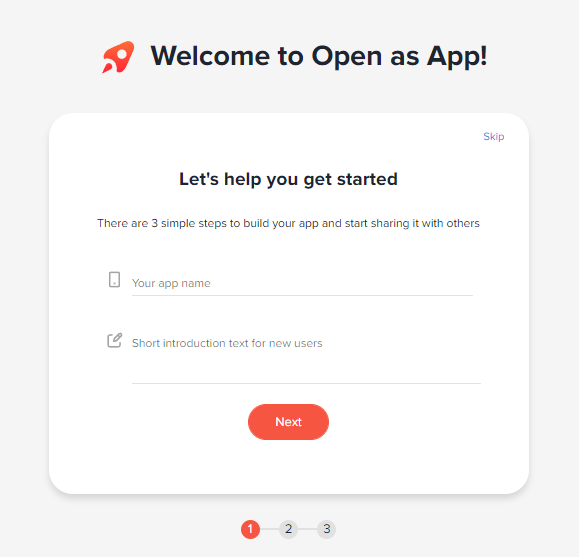
- STEP 1: Select the name of your app
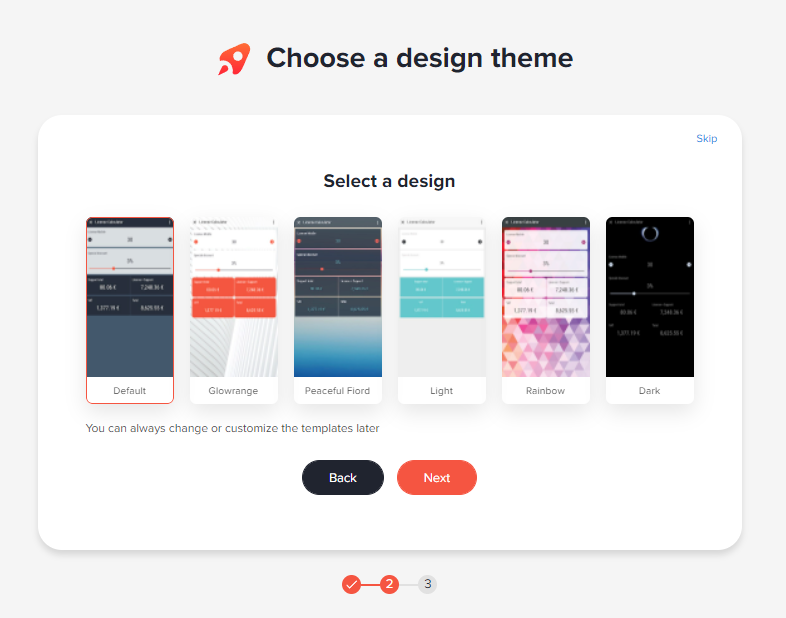
- STEP 2: Select a theme for your app
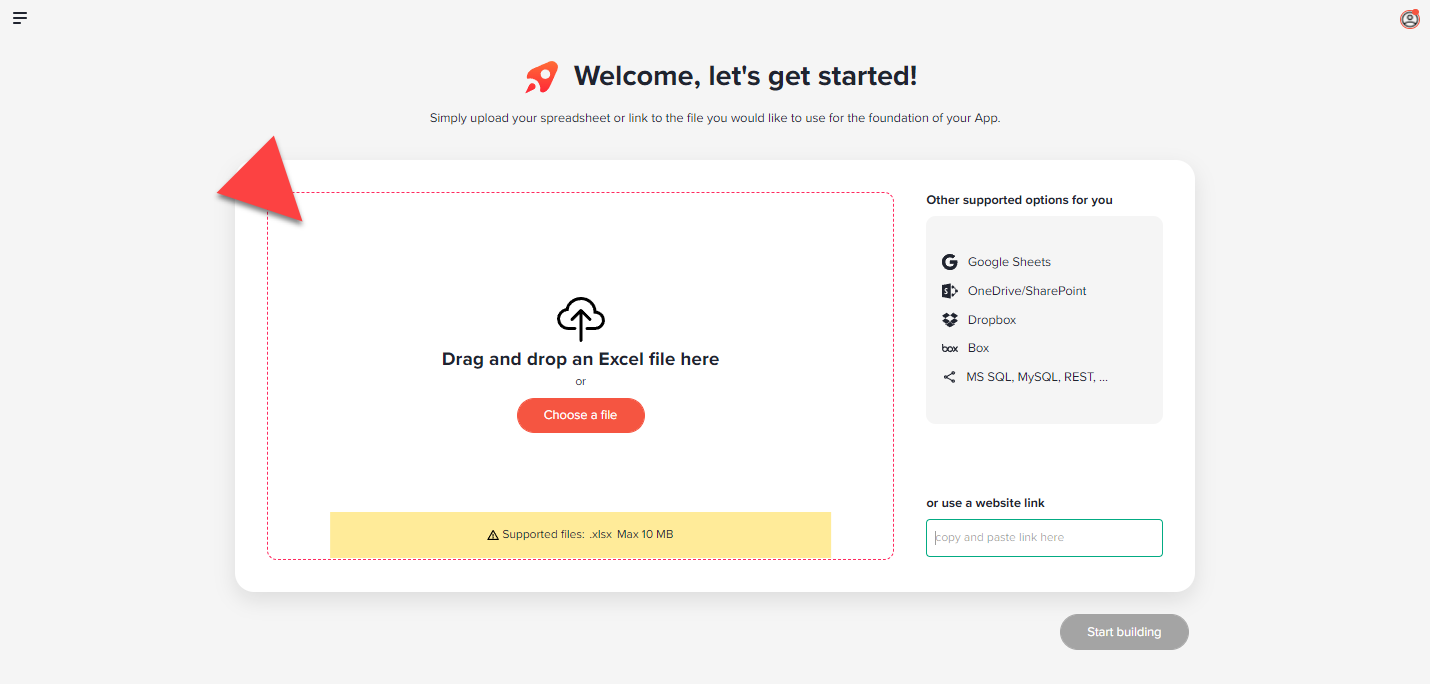
- STEP 3: Upload your spreadsheet
- STEP 4: Select relevant INPUT and OUTPUT cells.
- STEP 5: Publish your app
- Run your app on mobile devices
STEP 1: SELECT THE NAME OF YOUR APP
STEP 2: SELECT A THEME FOR YOUR APP
STEP 3: UPLOAD YOUR SPREADSHEET
The data source (file) can come from the PC as well as a third party online storage - for example, an Excel in your Dropbox, your OneDrive / SharePoint Online, or a Google Sheet from your Google account.
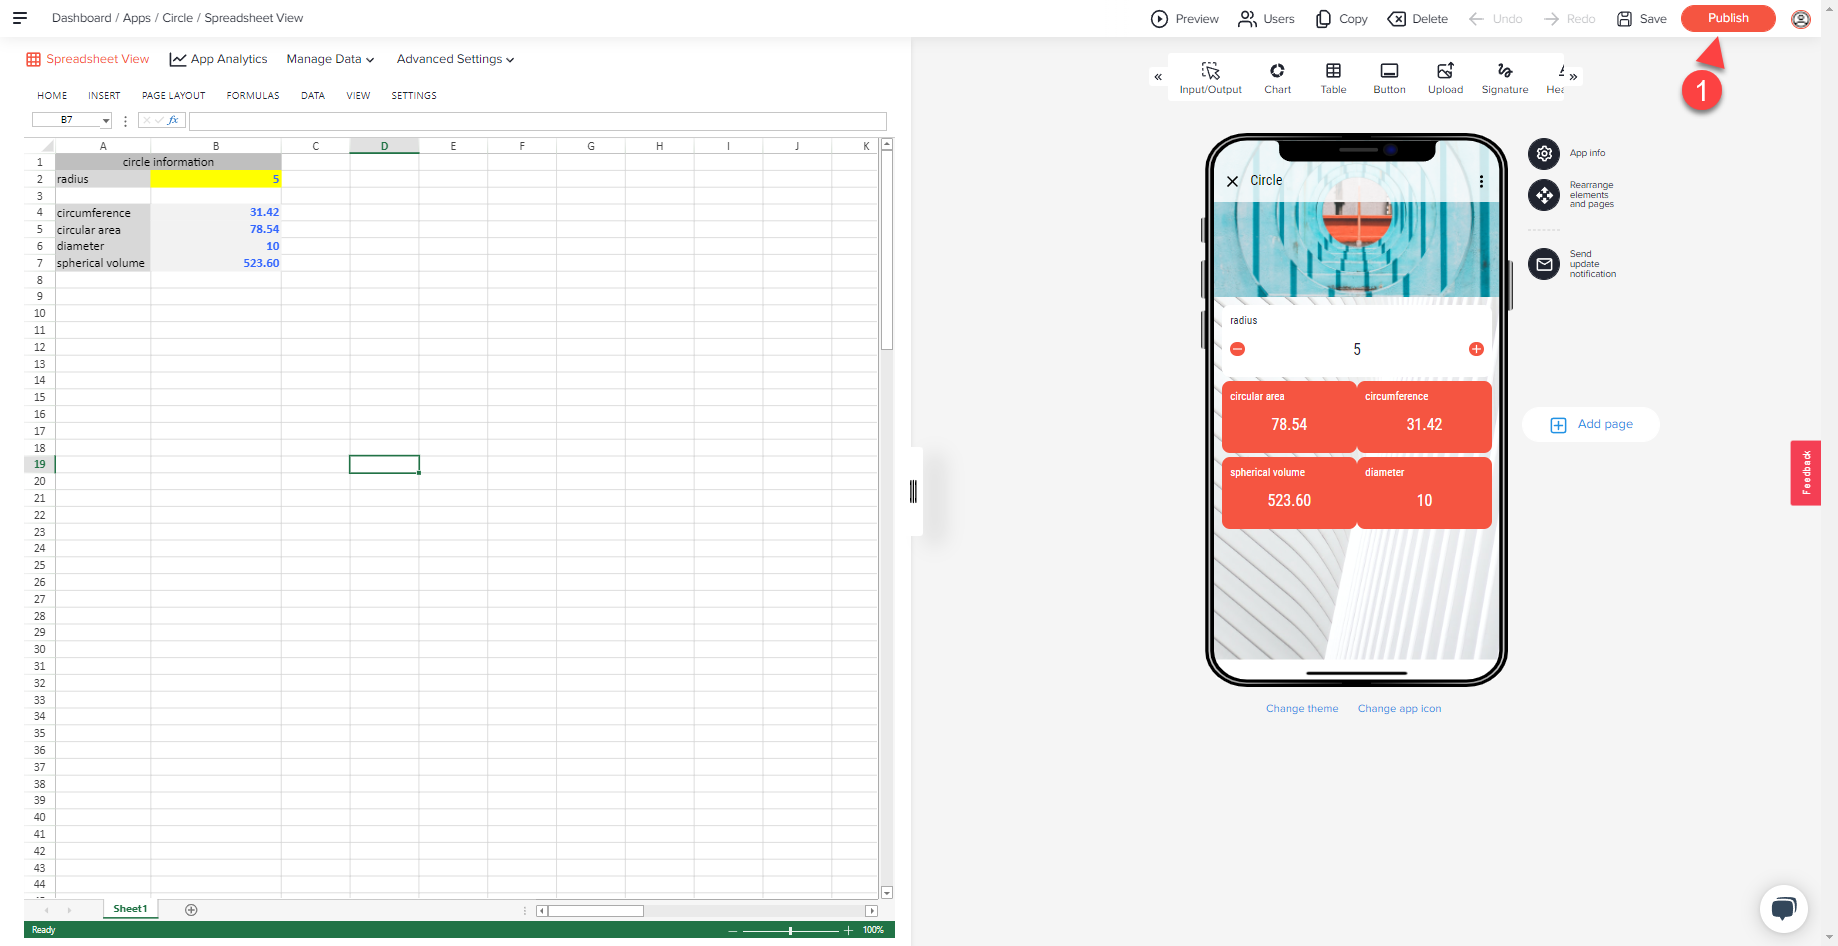
STEP 4: SELECT RELEVANT INPUT AND OUTPUT CELLS
Think of the app as a new front-end or mobile user interface for your Excel. What you do in the "Select cells" step is to specify which cells of your Excel you want to use and see in the app.
Note
It is not necessary to add all cells from Excel just because they are dealing with the calculation. It is sufficient to focus on relevant inputs and outputs. The logic of your Excel is completely preserved, as you will do nothing but use the cells in your Excel file with the app.
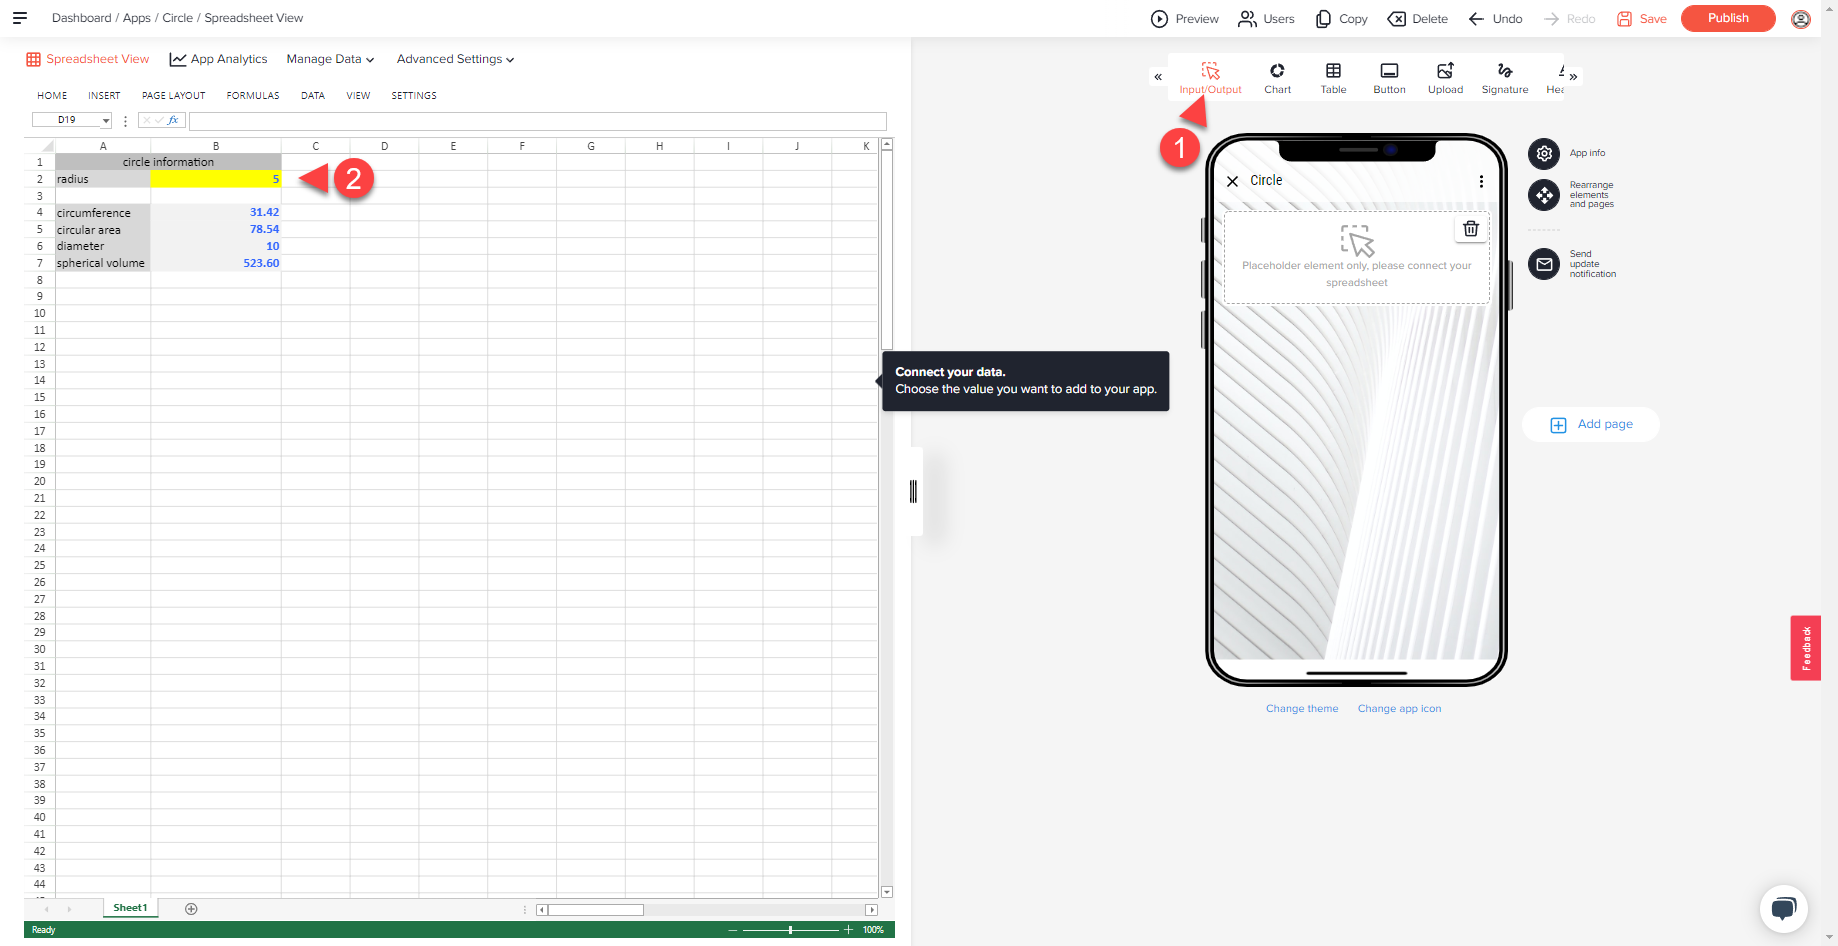
(1) Select the cell you want to add. (two options)
Option 1 - Right-click on the cell you want to add.
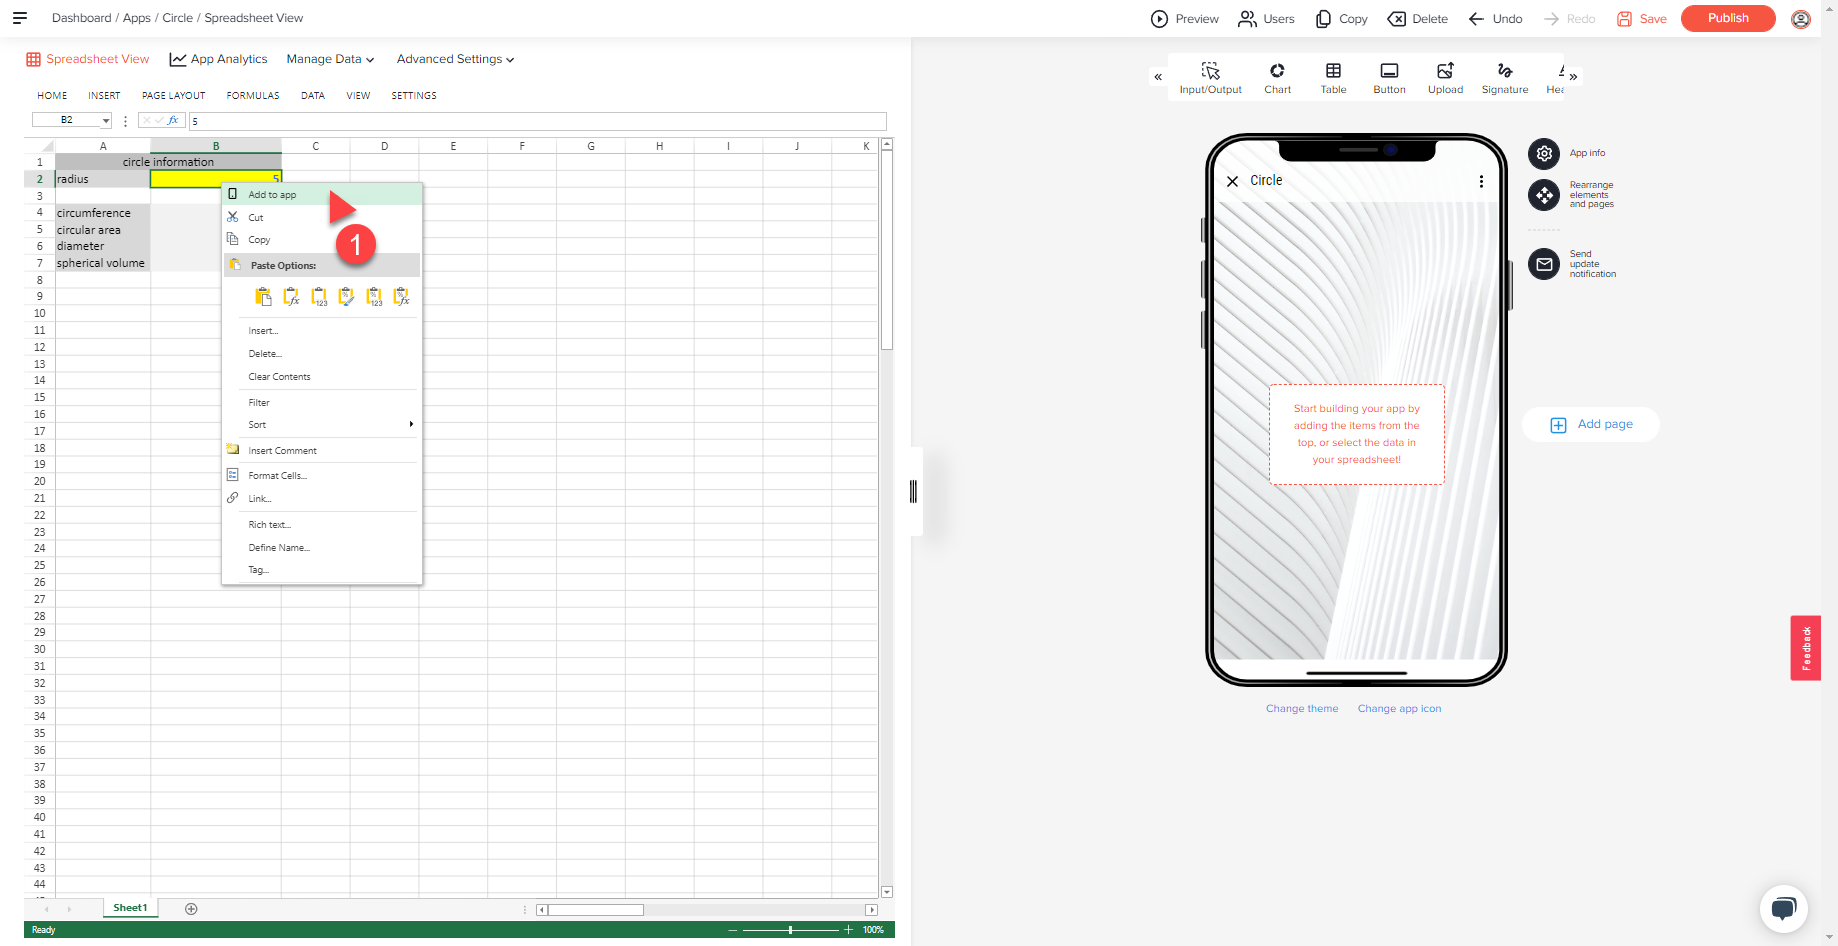
Option 2 - Input/Output Element
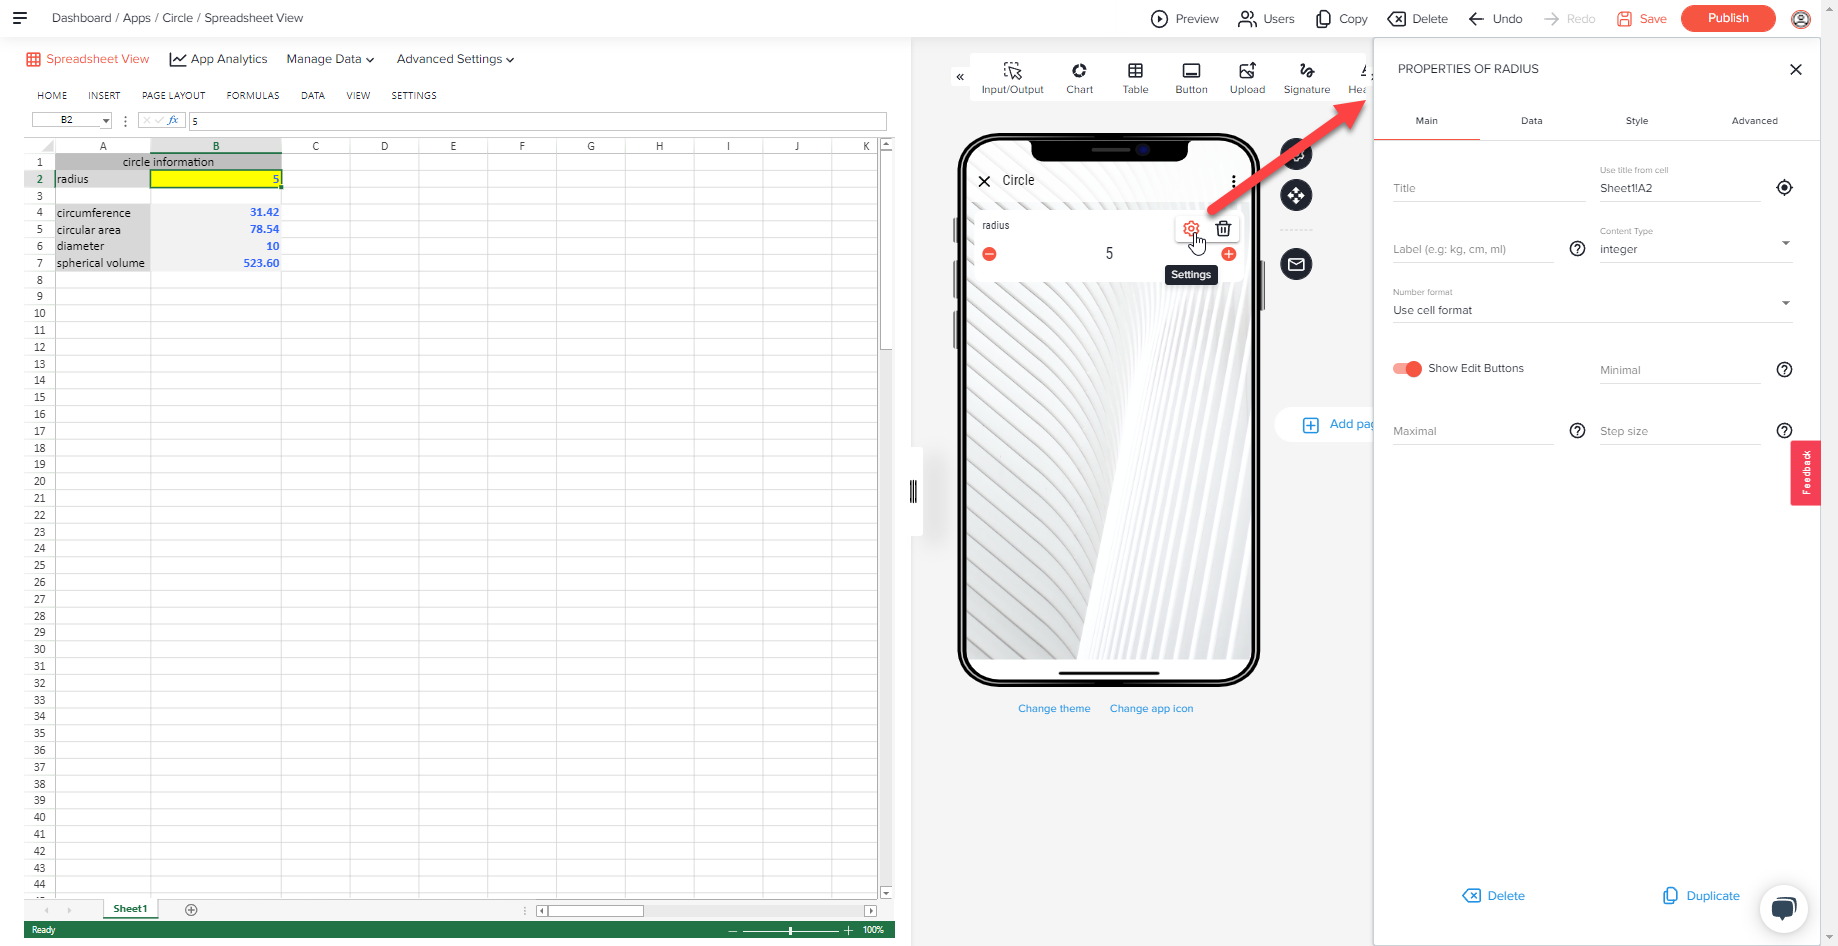
After a few seconds your element will be displayed. This now shows the cell from your Excel document. If desired, make changes to the appearance and format of the element here.
Note
The label of the respective cell is automatically transferred from the Excel file, if this is arranged logically. In our example, the labels are taken from column A.
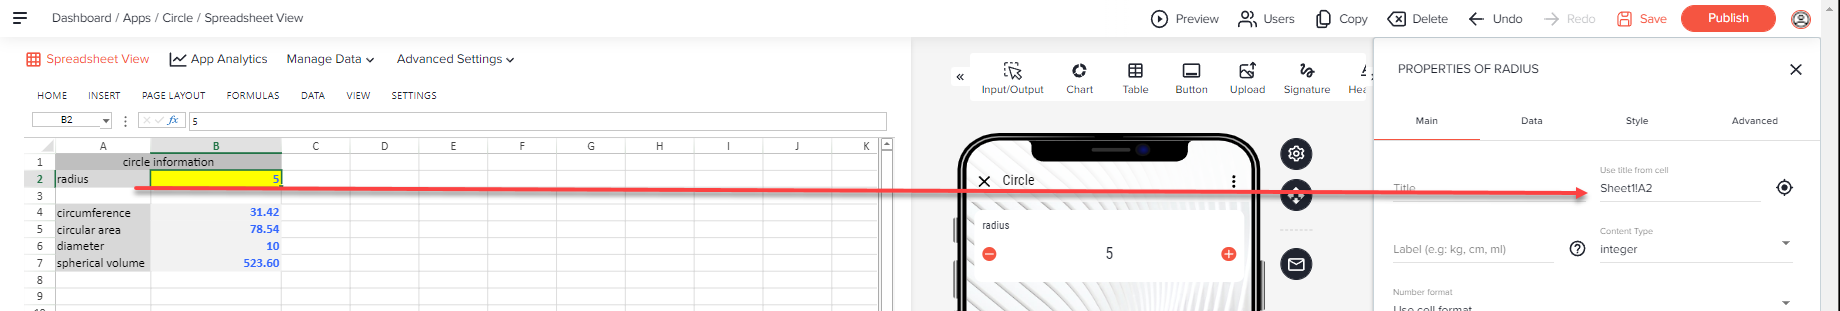
For our proposal, the wizard looks to the left of the selected cell until it finds a text. Otherwise, it looks up until it finds a text.
(2) Advanced Design
In this design step, you have many options to make your app even more professional - e.g. by adding a chart or making some optical changes.
Note
You can always - even after the app has been published - make changes and make that instantly available on all devices.
For the sake of simplicity and because the app is basically done, we will just change the image at the top of our app (Top Area Image) and give the app a personal touch.
- Click the gear icon where the name of the app is displayed. The icon appear as soon as you position your mouse cursor on it.
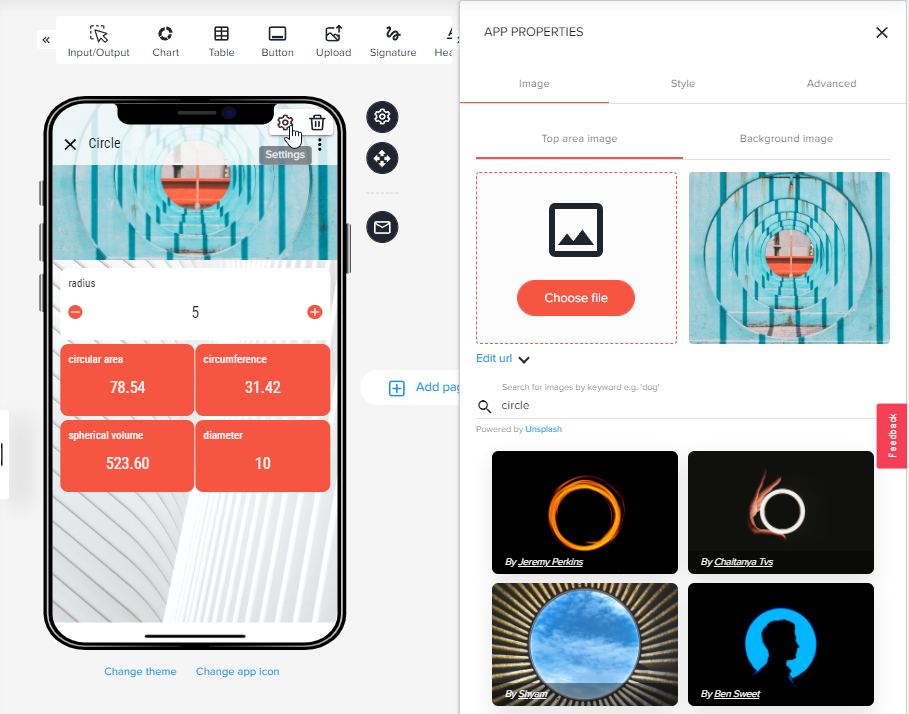
- Change the Top Area Image
- Confirm the change with a click on Save.
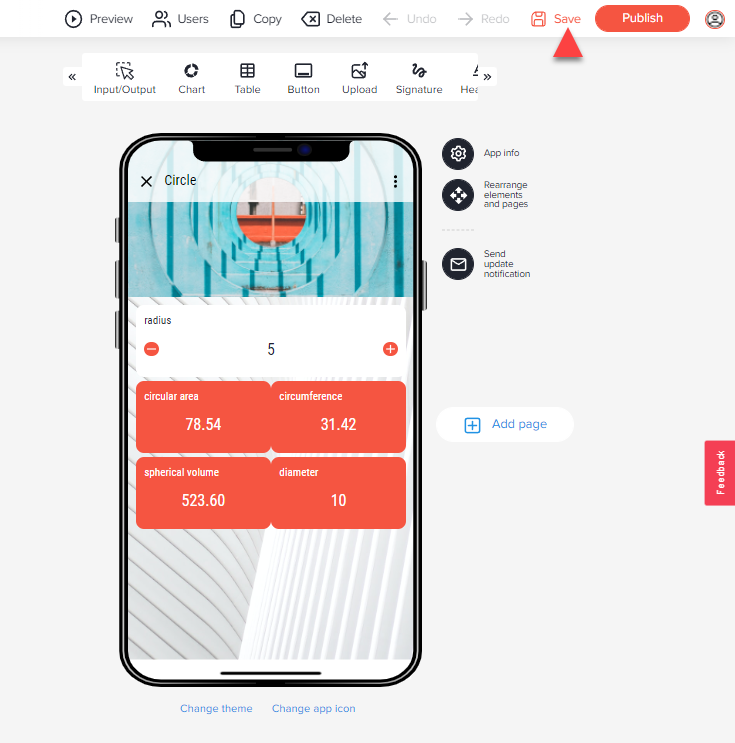
STEP 5: PUBLISH YOUR APP
The app can now be shared via the " Publish" button. There is the possibility to share the app with specific users and their email address or to create a share link to the app.
More infos: Publish & unpublish your app
RUN YOUR APP ON MOBILE DEVICES
The app can now be used by yourself and by your assigned users on iOS & Android via the Open as App app container or directly in the web.
- iOS: https://itunes.apple.com/de/app/open-as-app/id1084483622?mt=8&ign-mpt=uo%3D4
- Android: https://play.google.com/store/apps/details?id=net.openasapp.openasapp
- Web: https://www.openasapp.net/portal#!/client/myApps